Visualizing Power Consumptions on Grafana
Here it is explained how to visualize the power estimation computed by a Formula on a Grafana dashboard to obtain this kind of visualisation:
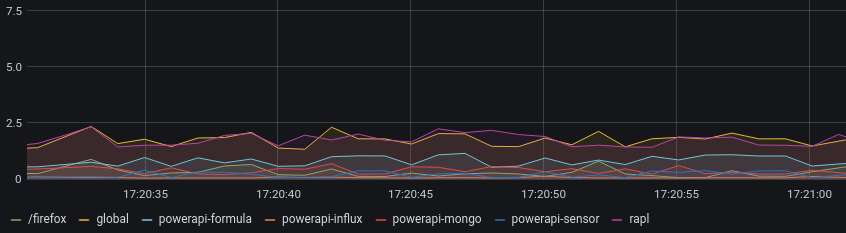
This screenshot shows the visualisation of power consumption of a Web browser and tools used for monitoring (Source, Destination, Sensor, Formula)
In this tutorial, we describe how to connect a Formula to a Grafana instance by using InfluxDB 2.X as Destination. Then, we will see how to configure Grafana to visualize the power estimation computed by the Formula.
This tutorial assumes that you know how launch a Formula and a Sensor to compute power estimation and that you have an InfluxDB 2.X and a Grafana instances running on your local machine.
The InfluxDB 2.X instance listen on port 8086 and Grafana instance listen on port 3000.
Connect Grafana to the InfluxDB 2.X instance
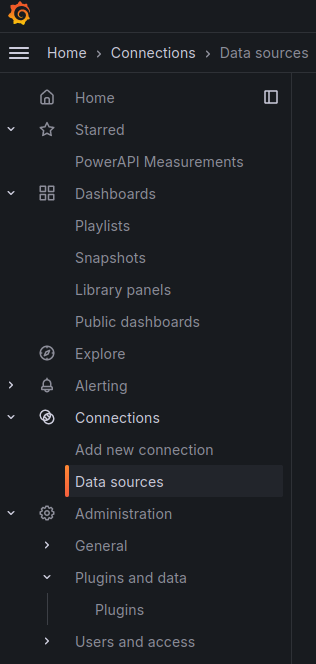
Connect to your Grafana instance and go to the `"Data sources"`` section (in the configuration part of the side bar).
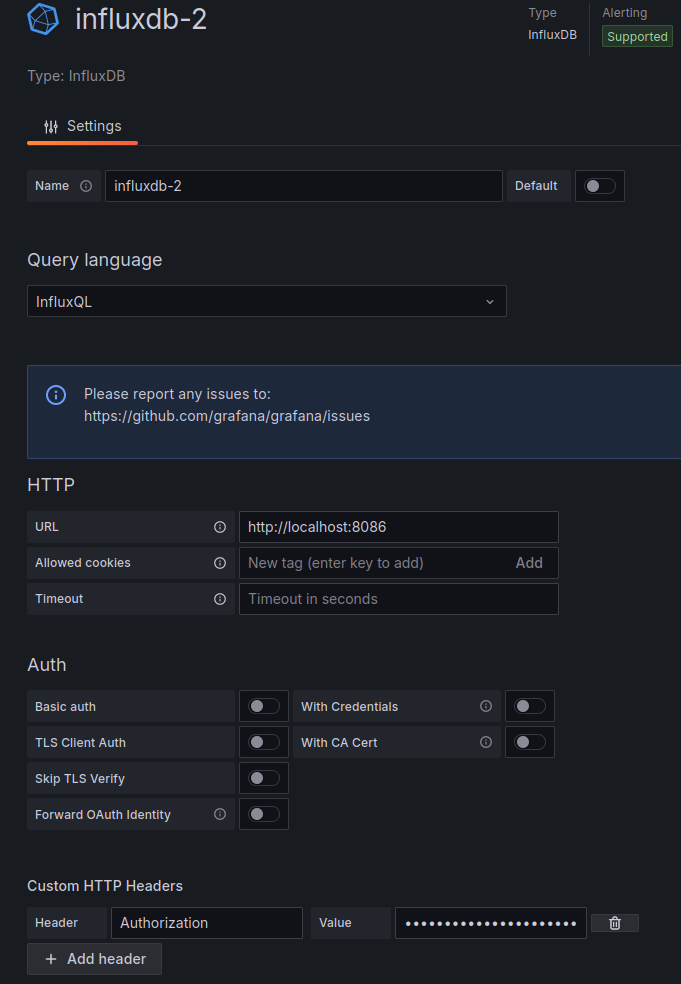
Click on the "Add new data source" button and select "InfluxDB". Enter:
- A data source Name (here we choose "InfluxDB-2"),
- A Query Language, i.e.,
InfluxQL - An instance URL (
http://localhost:8086) - A Custom HTTP Header called
Authorizationwith ValueToken <mytoken>, where<mytoken>is the token provided by InfluxDB 2.X for your organization. - A Database name, (here we choose
power_consumption) that is thedbvalue of your destination defined in your formula configuration.
Then click on the "Save & test" button. User and Password are not required as we use a token for authentification.
Visualize the power consumption on a dashboard in real-time
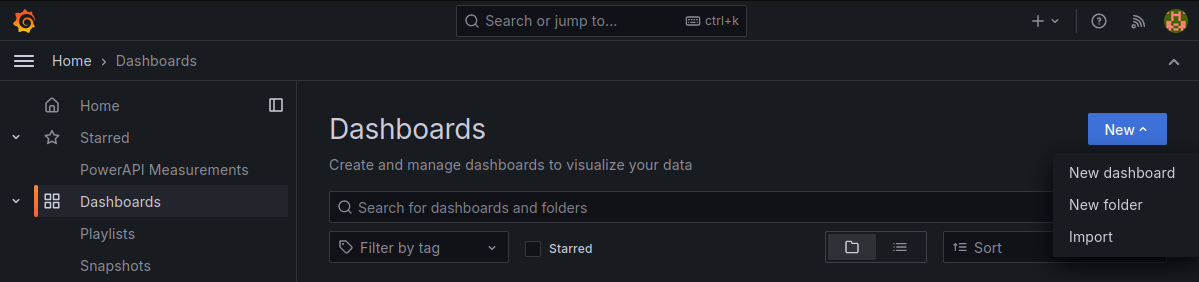
Go to the "Dashboard" section on the side bar and select on New > New dashboard. Then click on + Add visualisation Then select influxdb-2 as data source.
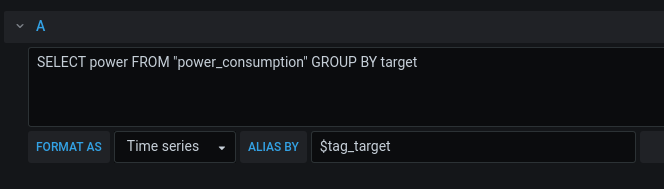
Click on the query edition button (the one with a pencil on it) and write the following query on the Query field to request the power estimations from the InfluxDB 2.X measurement:
SELECT power FROM "power_consumption" GROUP BY target
Then write $tag_target on the ALIAS BY field to label each graph with the target name
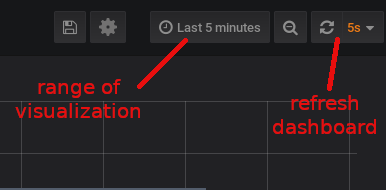
To display the power consumption in real time, you can update the range of the visualisation to last 5 minutes and the refresh dashboard parameter to 5s. This parameter are on the top-right corner of the UI.